
workflows · 04
The earnings-week loop: how record numbers became a red Friday, and who saw it coming
Here's a week that confused a lot of people. On August 26th, 2026, Nvidia held its Q2 earnings call. The wire's summary: net income more than doubled, to $59.7 billion. By Friday's close the stock was at 217.86 — down 4.4% on the day, on 195 million shares. Record numbers, red stock, and a thousand posts asking how that's possible.
Now walk the same week as someone who'd spent twenty minutes in three
terminal windows before the print. Nothing about that Friday would have
surprised you — and that's the whole case for the earnings loop this guide
teaches. (NVDA throughout as the worked example; the numbers are what was
on my screen at capture, teaching material and not opinions.)
Window one, the weekend before: NVDA EQ EM
EM is the earnings matrix — every quarter's EPS with actuals in green and estimates in white, a year-over-year growth grid, and forward multiples underneath:
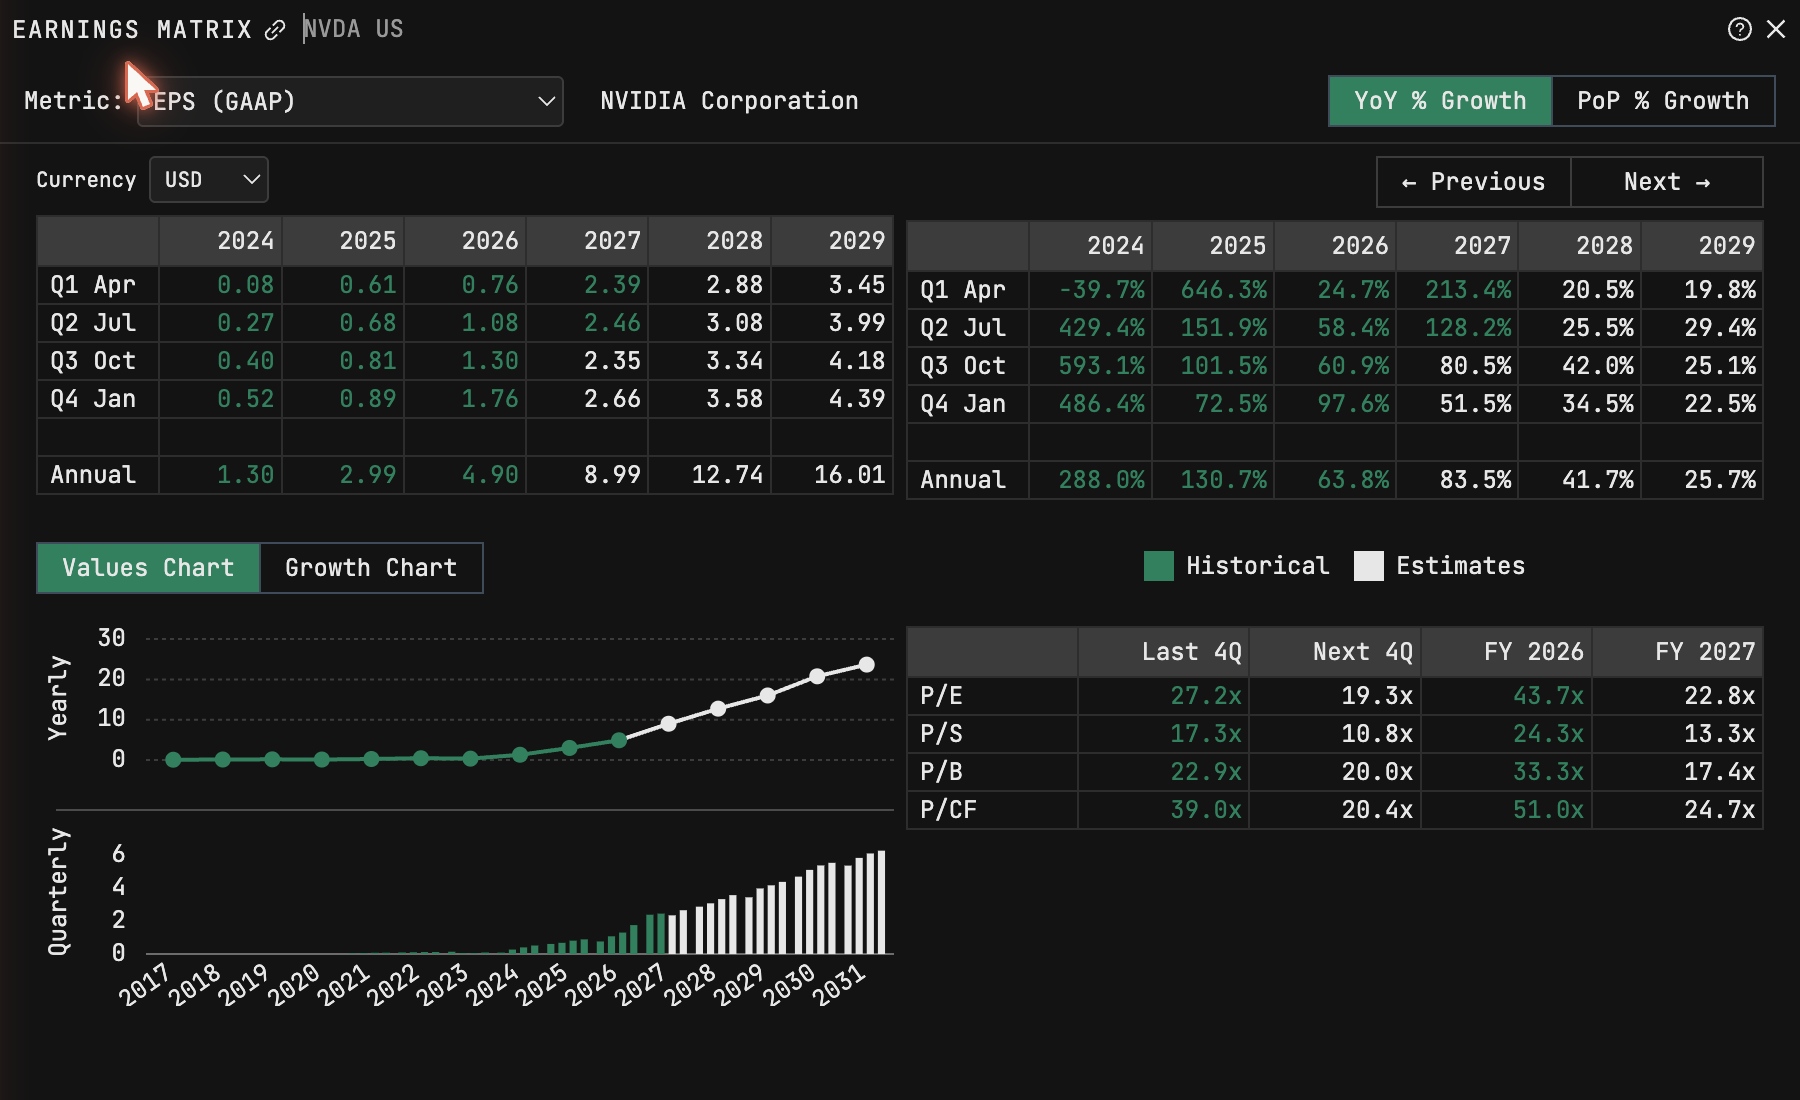
Two reads. The estimate row is the bar the print will be judged against — not "good or bad," but "above or below what's already priced." And the growth grid is the part that explained Friday in advance: the annual staircase on screen ran 288% growth, then 41.7%, then 25.7%. A company can double its income and still be decelerating, and markets price the slope, not the level. Anyone reading that staircase before the call knew a beat wasn't automatically a green day — the stock was priced at 43.7x forward earnings for fiscal 2026, and at that multiple, the slope is the story.
Window two, one night before: NVDA EQ TRAN
The transcript hub holds every call, and by the time I captured it, the August 26th call was already transcribed in full — participants listed, every prior quarter one click down the rail:
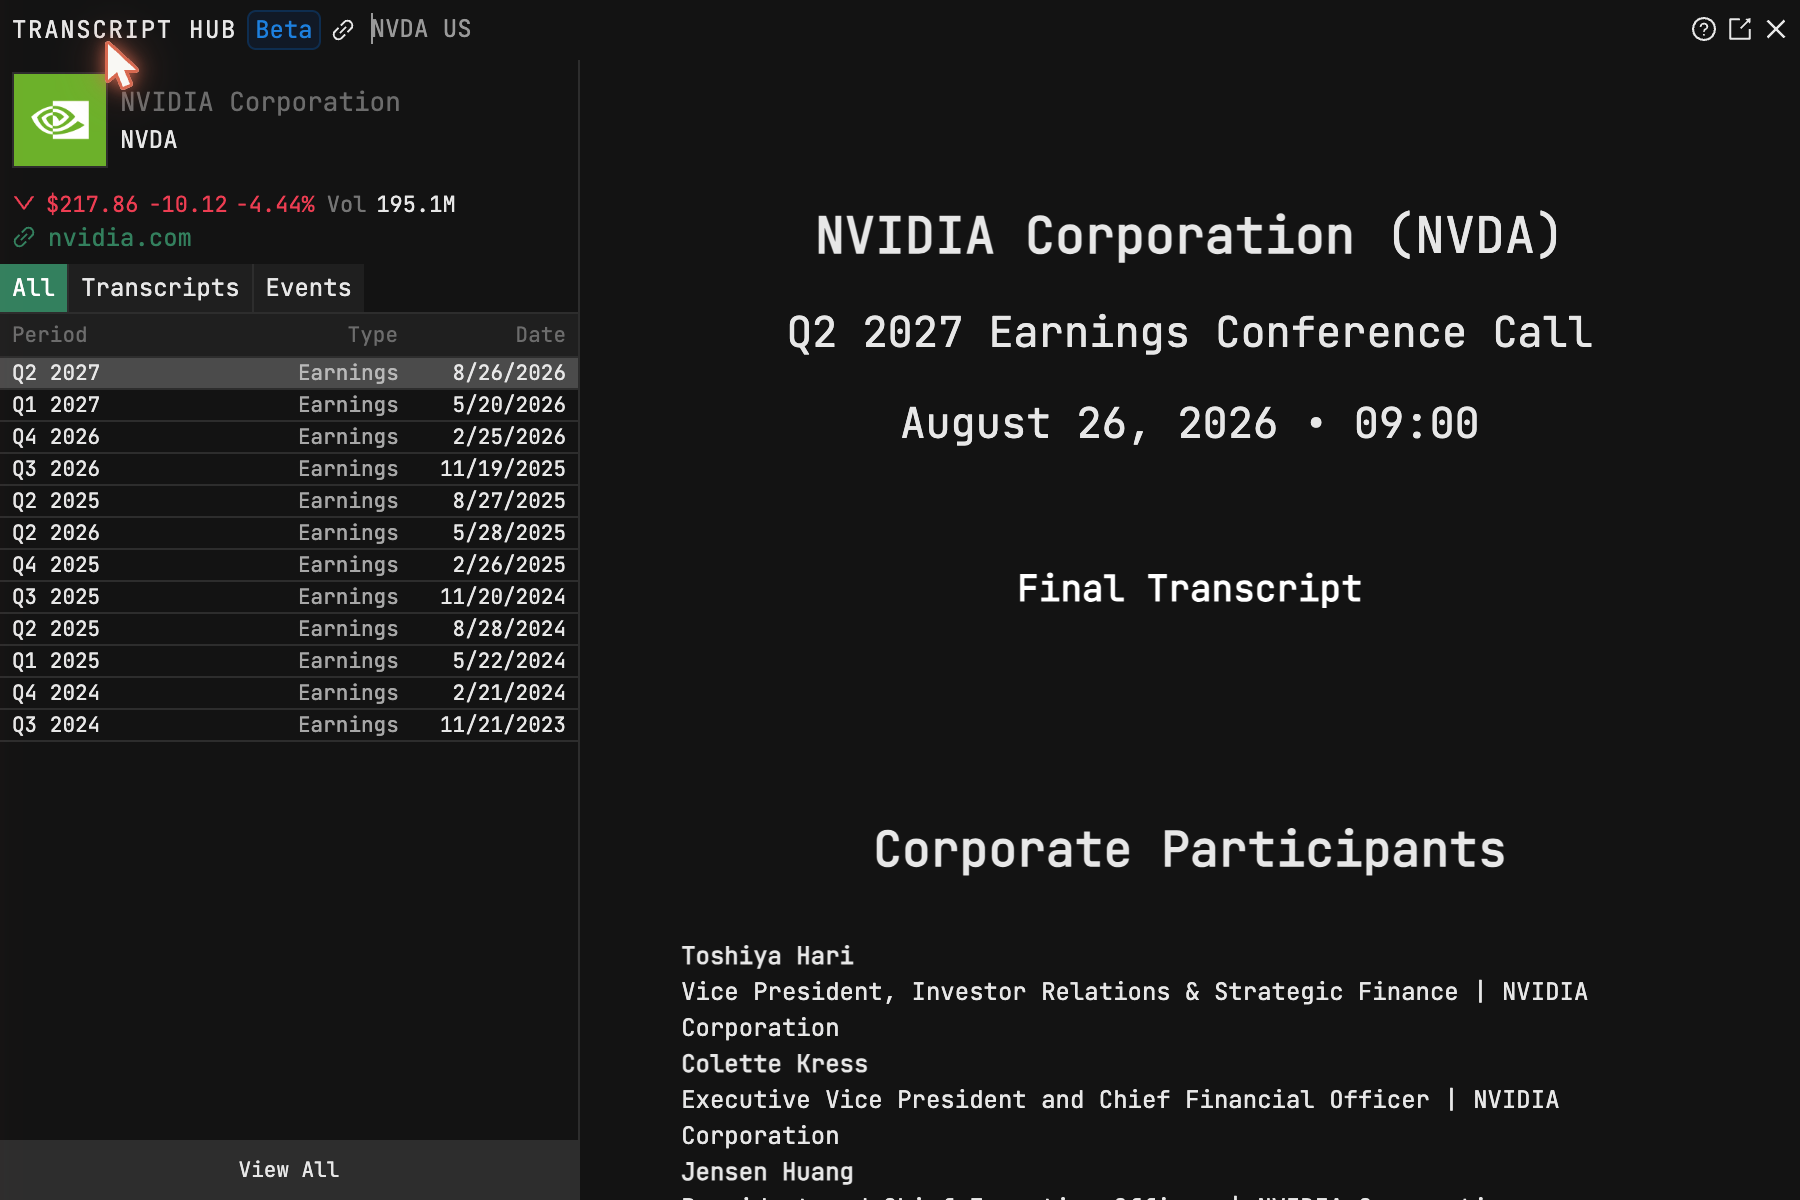
The pre-print read is one call old: open the previous quarter's Q&A, because the analysts' questions are a map of what the market was worried about ninety days ago. The new call gets scored on those worries. When management answers this quarter what it dodged last quarter — or dodges it again — that's the tell no headline number carries. (TRAN sits behind the paid seat; the fence runs where the expensive data is.)
Window three, the day of: NVDA EQ OMON
The chain is the crowd's forecast with money on it. Before a print, implied volatility on the near expiry is the size of the move being priced, and by that Friday the chain had settled back to the mid-twenties with call volume stacked at 220 and 225 — positioned, not panicked. When a chain prices a huge move and the company delivers merely a big one, "beat and dropped" is the mechanical result. The trader who checked the chain knew what "priced for perfection" looked like in numbers, not vibes.
The loop, assembled
Per name, once a quarter: EM on the weekend for the bar and the slope. Last
quarter's Q&A the night before for the standing worries. OMON on the day for
what's priced. Then the release itself in CF — the primary document, not
the coverage — with a tamed wire running
beside it. Twenty minutes, and the most confusing Friday of the summer reads
like a sentence you'd already diagrammed.
Tickers on this page are teaching examples, not recommendations. TickerFluent publishes education, not investment advice.