
workflows · 02
Stop finding out late: a watchlist wall that watches while you don't
Saturday afternoon, August 29th, market closed, every finance app on my phone asleep. At 2:40:06 PM a red banner painted itself across the terminal: IRAN DEPUTY FOREIGN MINISTER SAYS NOT IN A HURRY TO REOPEN STRAIT OF HORMUZ. I had no position that cared. But picture the version of that moment where you do — where the name it touches is one you'd been meaning to watch, and the next time your usual feed mentions it, it's Monday, it's moved, and the decision got made without you.
That's the problem this guide kills. A broker-app watchlist doesn't kill it —
it refreshes when it feels like it and shows prices with no timestamps, so
you can't tell a live number from a stale one. You're not watching the
market; you're looking at a picture of it, taken at some point. Godel's Quote
Monitor is the watching version: rows that flash as trades print, a latency
column showing the age of every number, a chart and wire that follow your
clicks, and alerts for the hours you're
elsewhere. The triage loop
decides what a name is once you see it; this screen is how you see it first.
(Practice names are AAPL, NVDA, SPY — liquidity choices, never
recommendations.)
Build the list once, use it everywhere
Backtick, QM, Enter. The empty window's controls hide in its corners — the
… button top-left creates lists:
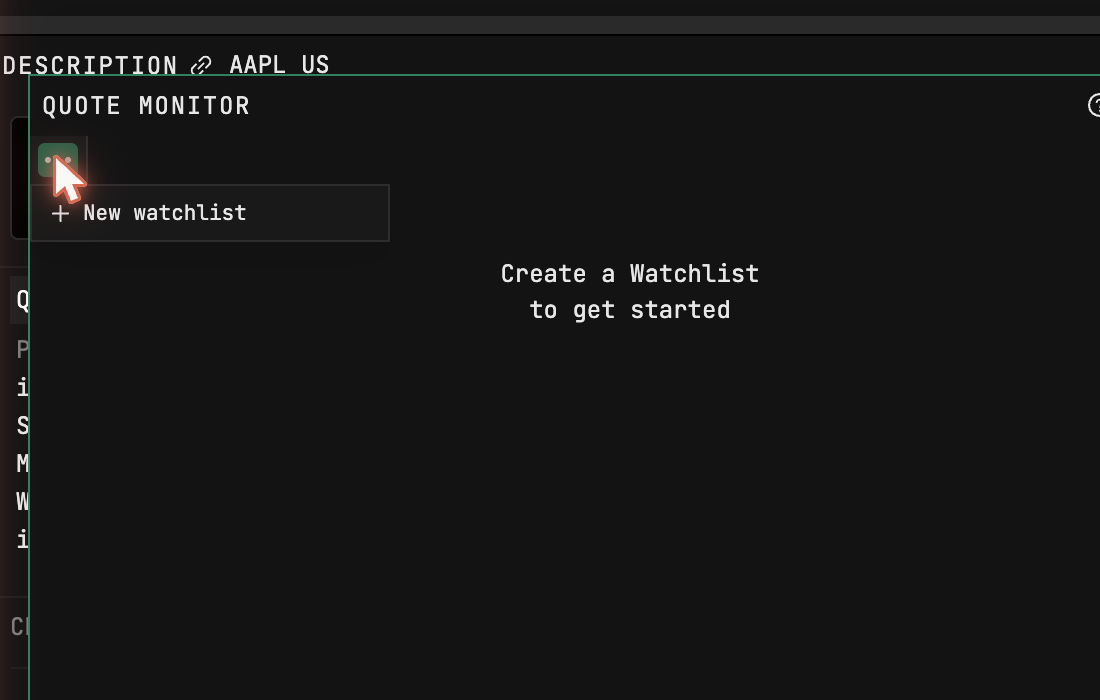
Lists exist once, account-wide: any window on any layout can display the same list, and editing it anywhere updates it everywhere, so your morning screen and your research screen never drift apart. Add a few tickers and watch the flashing start — each flash is a trade printing, live, which no broker app ever showed you.
Nobody hand-types a real list: Ctrl+I batch-imports comma- or
newline-separated symbols at about ten per second, up to 400 names per list,
with multiple list tabs per window — holdings, the sector you're stalking,
this quarter's reporters. International names take their venue suffix
(AZN LN, UBI FP, P911 GY, AC CN) and arrive wearing the (D)
delayed badge; I keep them on their own tab so
live and delayed numbers never sit in one
column looking equally fresh. One warning: removing a ticker has no undo.
Columns that show you the truth
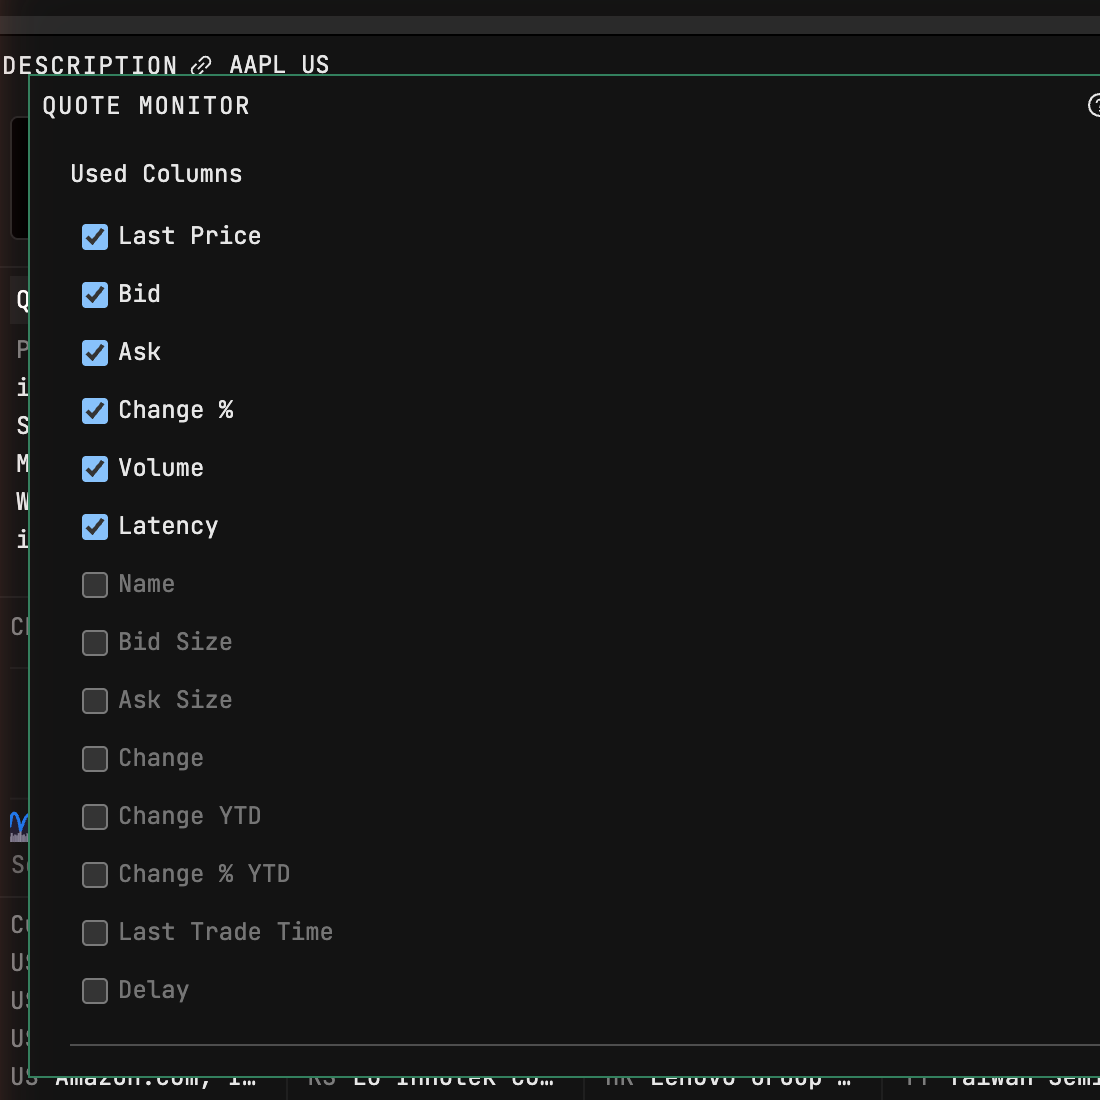
The gear opens Used Columns. Keep Latency — the age of every quote, on screen, permanently. Add Delay to make the badge explicit, and Change % YTD beside plain Change % so a daily move carries its year's context and a 2% bounce in a name down 40% reads like what it is. Bid/Ask and sizes are paid-seat columns; on free they read "Account required."
Click a header to sort. Drag rows to hand-order — noting an active sort overrides your order until cleared, which is why my core list stays unsorted.
The click that runs the room
Open a chart and news beside QM, arrange — list left, chart and wire right — and color-link all three with the chain icon:
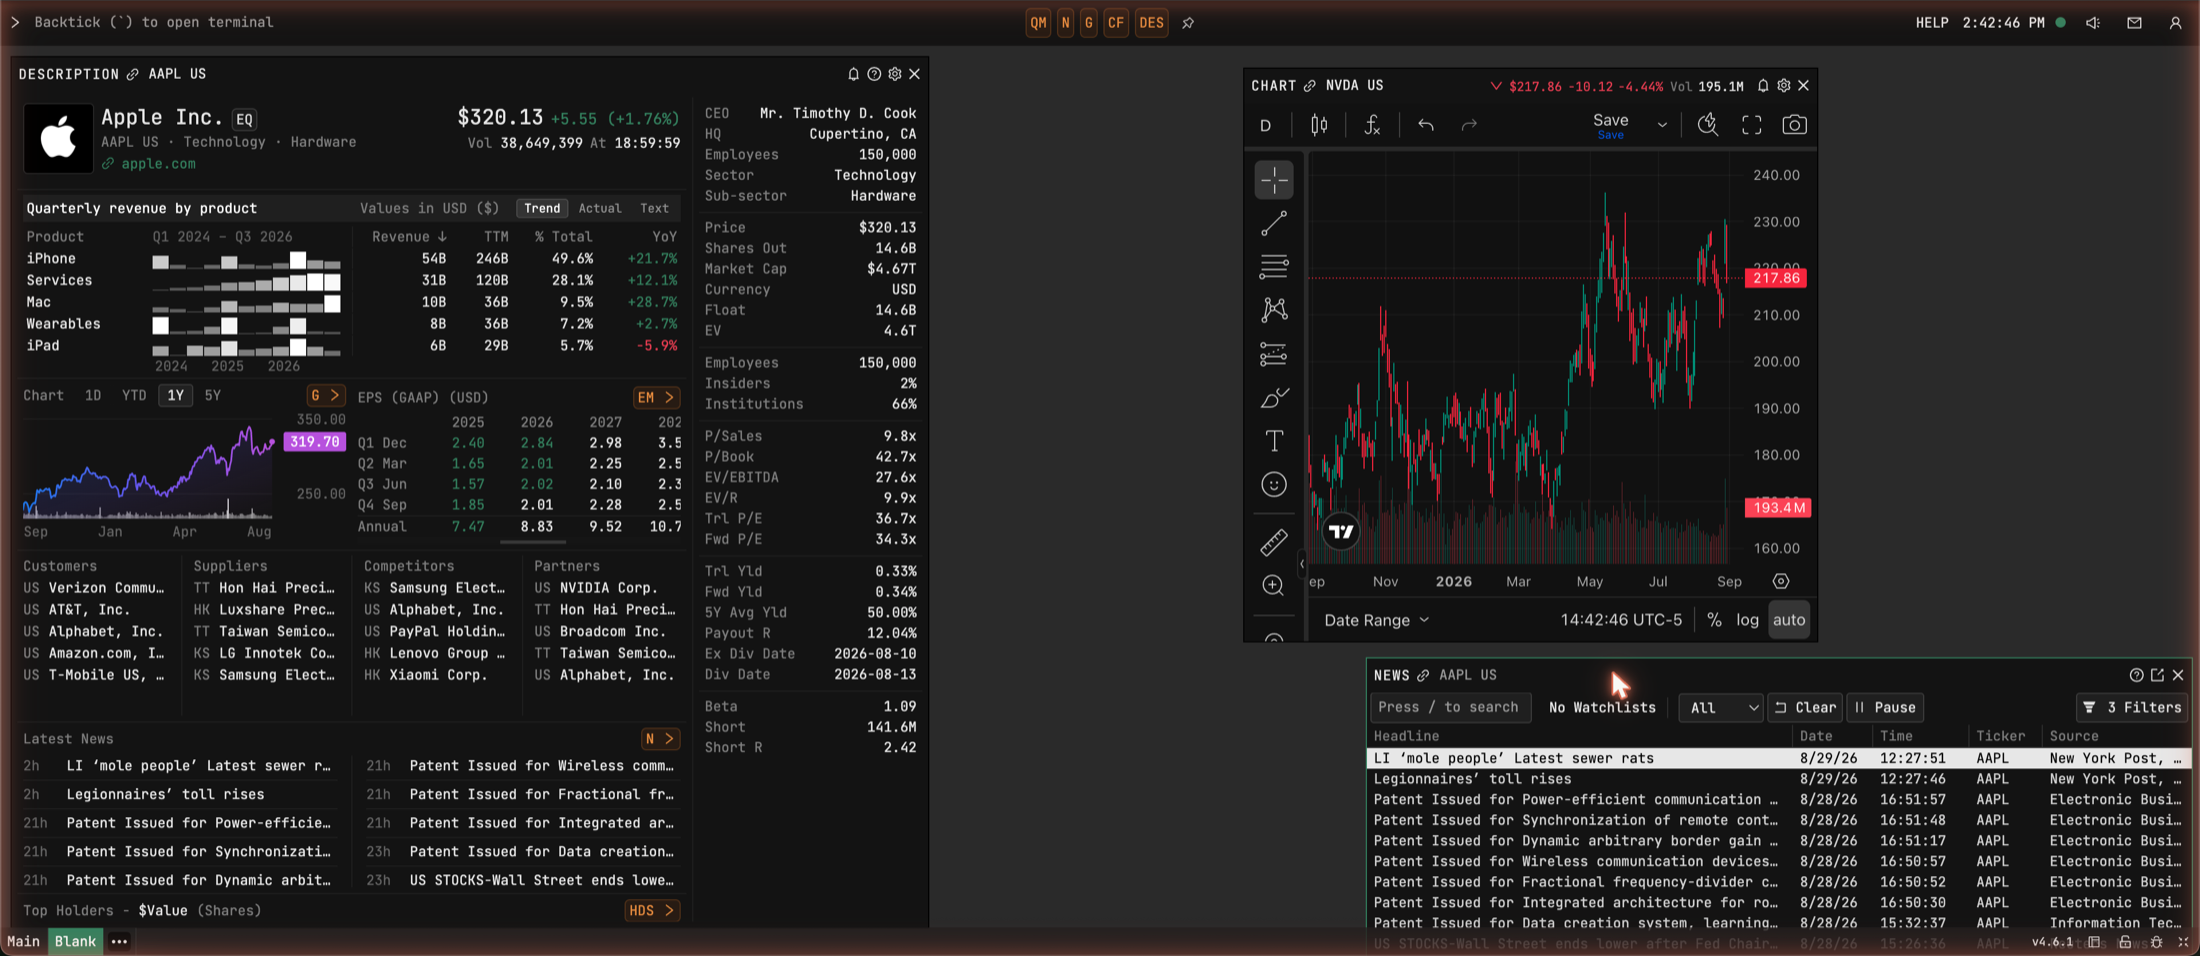
Now a row click re-points the chart and re-scopes the wire, and you're
auditioning names as fast as you can click. Scope the news window to the
whole list (its toolbar selector reads "No Watchlists" until you pick one)
and the wire covers your entire book. HMAP turns any list into a heatmap
when you want the day in one image:
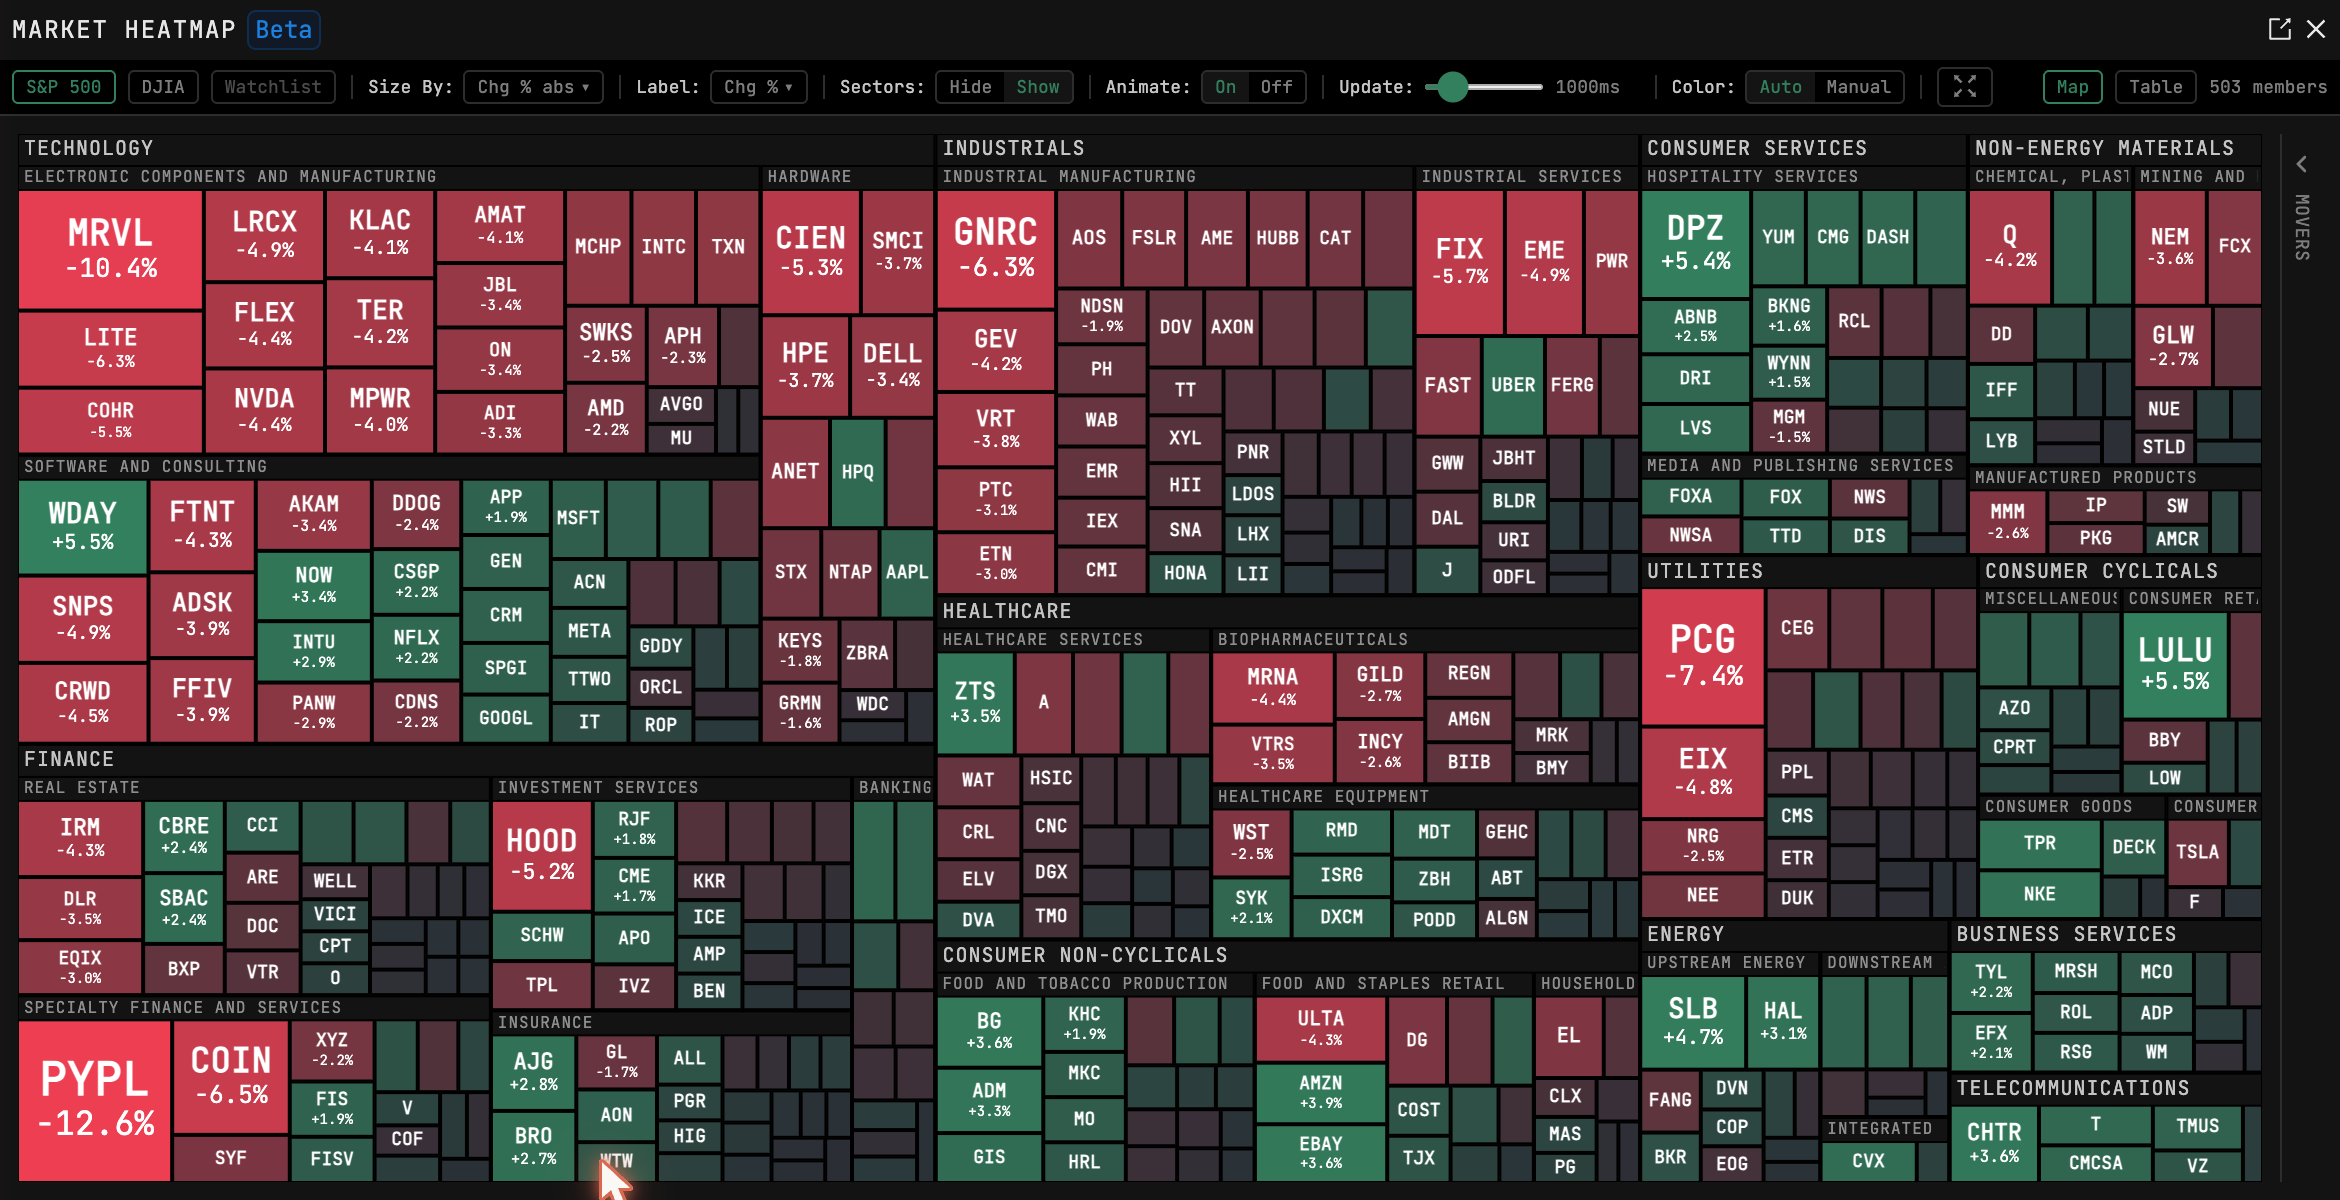
That Friday's map, incidentally, is the argument for the whole screen: PayPal closed down 12.6% that day. On a wall like this, a move that size in a name you track is a red tile you notice at a glance — not a headline you meet two days later. What you do about it belongs to the triage loop; seeing it in time belongs to this screen.
When it fights you
Import looks stuck: 400 names at ten a second takes forty seconds — wait
before assuming a hang. A row looks frozen: check for the (D) badge, delayed
data drifts rather than flashes. Bid/Ask blank: paid tier. Clicks not
driving the chart: all three windows need the same color link. Row-click
behaving oddly: someone changed the setting in PDF — yes, the settings
command is called PDF. And there's still no undo on removal; re-add by hand.
Next: alerts, for the hours the wall runs without you.
Tickers on this page are teaching examples, not recommendations. TickerFluent publishes education, not investment advice.